Bitcoin Leverage Could Be ‘Flushed’ Causing Potential 20% Drop

[ad_1]
Now that the long-awaited spot Bitcoin ETFs have been launched, the hype has faded, and crypto markets are correcting as analysts predicted. However, a looming Bitcoin leverage flush out on major exchanges could send digital asset prices tumbling even further.
Not only were analysts correct about a post-ETF market pullback, but they are now predicting a substantial Bitcoin leverage flush, bigger than the two recent ones.
Binance Royal Flush
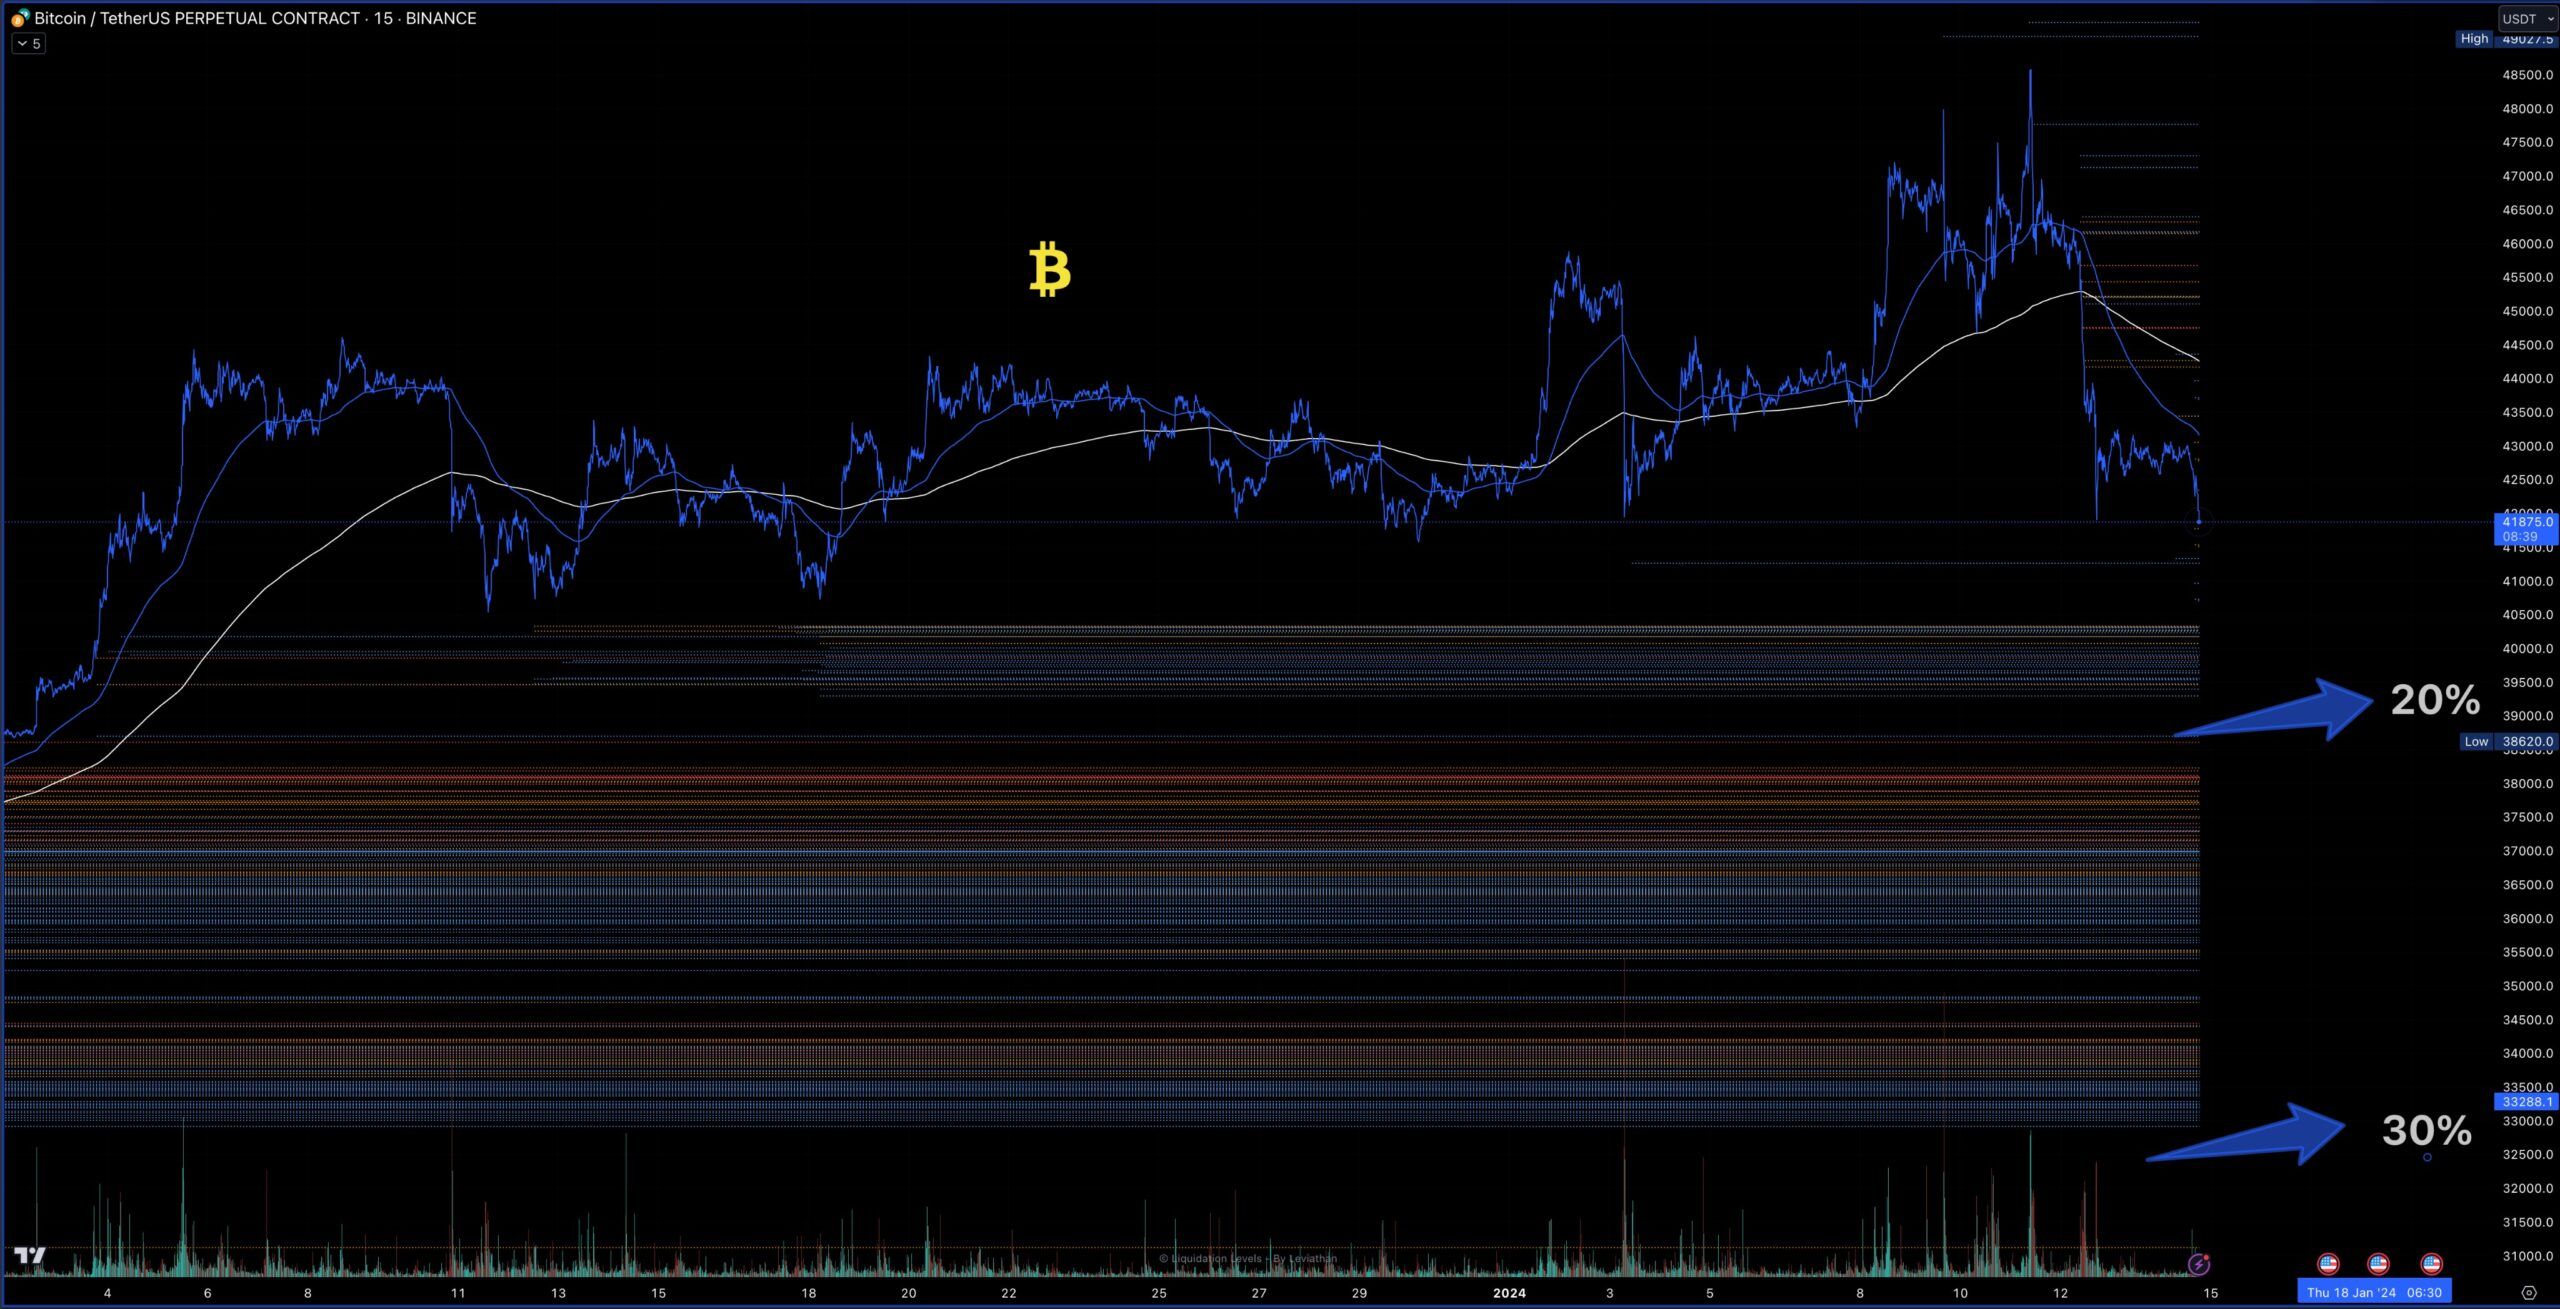
On January 15, crypto commentator ‘MartyParty’ predicted what he called a Binance ‘Royal Flush’ before the Bitcoin halving. Binance is one of the largest crypto derivatives exchanges, with a daily volume of around $34 billion.
He observed that a flush to $39,500 would clear all longs since December 4. This would result in a 20% correction, which is typical of previous pre-halving cycle dips.
In 2020, before the last halving, Bitcoin markets corrected by 50%, but that was largely due to the pandemic-induced black swan event. However, 30% pullbacks are also common, and this could send BTC prices back to $32,800, clearing all longs since October.
He added:
“This would open the door to highly desirable life-changing new longs and spot entries into Bitcoin and all altcoins.”

Leverage flush-outs are common in crypto markets where speculators build up over-leveraged trades that must be expunged from the system to return to normal trading conditions.
Read more: Where To Trade Bitcoin Futures: A Comprehensive Guide
The analyst observed one difference between this and previous cycles, which is the new element of spot Bitcoin ETF issuers:
“They may not want Bitcoin to drop below $40k or may even defend the previous flush wick at $41,500. We will see. When they defend we will see the bull run begin.”
Bearish Weekly Candle?
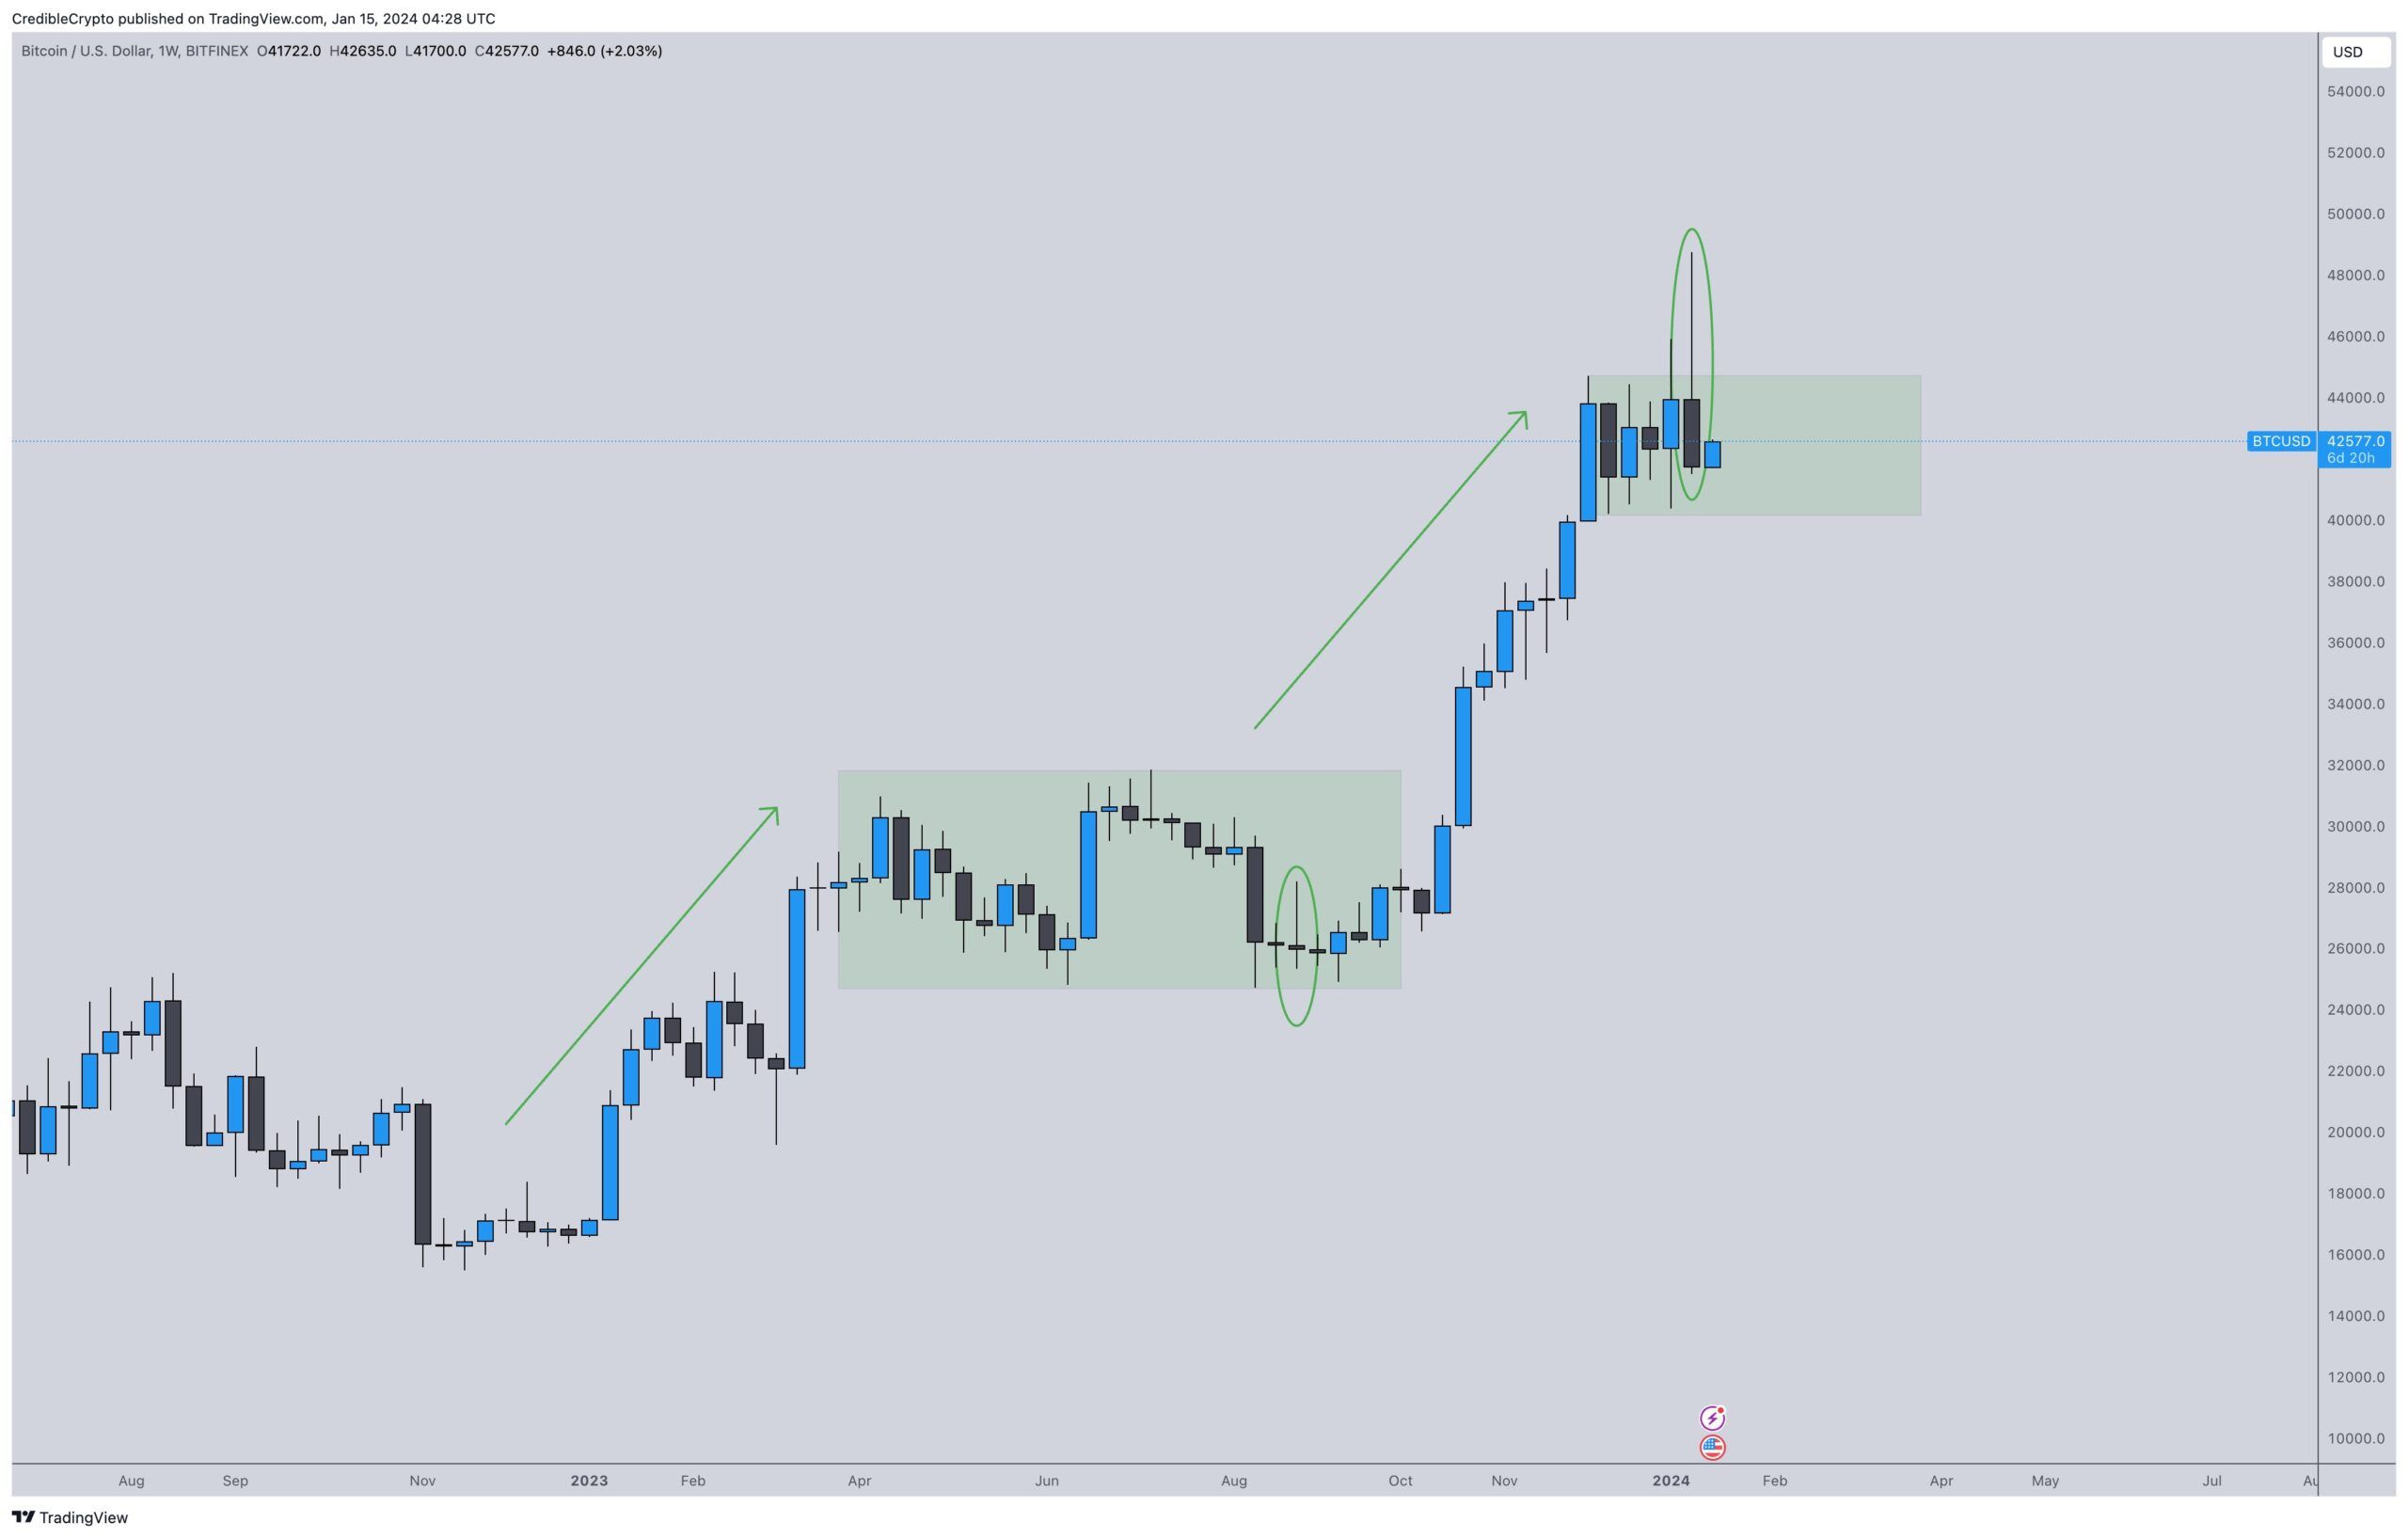
Fellow analyst “CrediBULL Crypto” took a look at the weekly candle close, which was decidedly bearish. The candle looks bad in isolation, but zooming out paints a more bullish picture, he said.
“The last time we got this candle people also said it was occurring at the ‘end of the uptrend’ when in reality it was just in the middle of a larger uptrend — the same could be said for what we are seeing now.”

BTC was trading at $42,700 at the time of press, following a slump to $41,750 during early trading in Asia.
The asset spent most of the weekend consolidating around this level after cooling off from its ETF-driven pump to $48,500 last week.
Disclaimer
In adherence to the Trust Project guidelines, BeInCrypto is committed to unbiased, transparent reporting. This news article aims to provide accurate, timely information. However, readers are advised to verify facts independently and consult with a professional before making any decisions based on this content. Please note that our Terms and Conditions, Privacy Policy, and Disclaimers have been updated.
[ad_2]
Source link
